High Performance IoT Service
Recently we developed a highly scalable system for capturing data sent from IoT devices. The challenge was to develop a very low latency and fault tolerant system that could support the C10K type loads that are typical for IoT services, and get close to real time dashboards that would present the state of the various types of devices that were transmitting data.
A few basic assumptions were made when we developed the system, which more or less mirror the classic principles propounded by Joe Armstrong when he developed Erlang:
- A container (all components of the distributed system are deployed as docker containers on kubernetes) can die at any time. It should result in no data loss.
- IoT devices due to their sheer number will always send data at a faster rate than databases can store them.
- A front-end writer will write data faster than the corresponding back-end writer can. Hence there is a need for persistent buffers to ensure no data loss.
- Asynchronous fault-tolerant systems are needed to ensure that eventually all the data gets stored, analysed etc. without causing any response/latency issues to the transmitting IoT devices.
We tested a few popular technologies such as
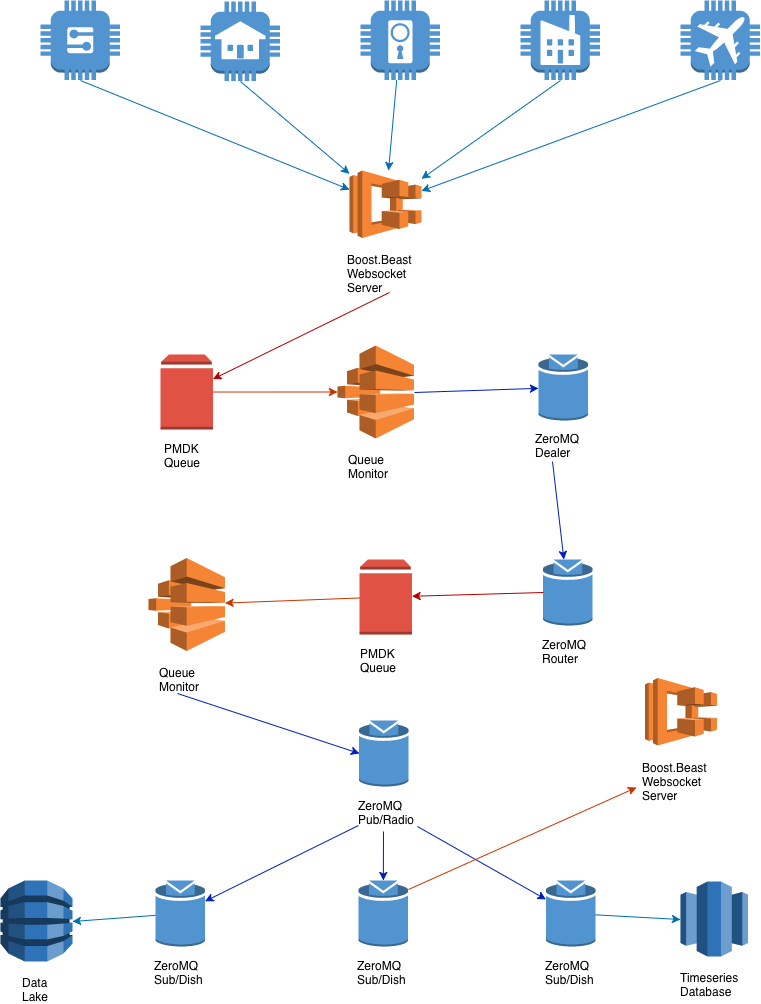
service->kafka->consumer->databases, service->redis->consumer->databases etc. and eventually settled on a very lightweight and highly scalable architecture that uses PMDK (persistent memory development kit) along with ZeroMQ to provide the best combination of very low latency, easy maintainability and scalability. In addition this simplified our software stack as we did not need to deploy and manage external complex systems like kafka, zookeeper, redis etc.The following high level diagram (intermediaries such as load balancers, VPC's etc omitted for brevity) illustrates the high-level architecture for the system.

Web Service
The web service is a Boost.Beast based web socket server that easily supports C10K type loads from the IoT devices. IoT data received by the service is stored to a local persistent memory queue implementation (small size, which may be replaced with a circular buffer implementation). This ensures that we can acknowledge writes in the quickest and safest way (pure memory would be quicker, but not as fault tolerant).
Front End Queue Monitor
Front end queue monitors are deployed on the same containers as the web services (a single dedicated thread on the same application). The monitor polls and picks up (via
peek operation) data from the head of the queue, and writes them to a ZeroMQ Dealer socket which is bound to a front end router. Once the data is written to the socket, the queue entry is removed (via a pop operation). Prometheus gauge metrics are maintained for the size (number of unconsumed entries) of the queue, to give us quick insights into any hot spots or issues with the entire pipeline.Middle Tier
The front end router receives messages from the front-end dealers, and saves them to another local persistent memory queue (larger queue as this tier operates on the fan-in model). This ensures that we do not run into messages being dropped on the front-end dealer sockets due to back pressure. Another queue monitor picks up messages from the head of the queue and publishes them to a ZeroMQ publisher/radio socket. Note that we have tested radio sockets, but have decided to hold off on using them till they become mainstream.
A subscriber/dish also makes the data available via another web socket service for client applications (web, mobile etc) that are interested in following real time events published by specific IoT devices. It is possible to have this on the ingress into the system, however for most practical purposes the raw IoT data is not of much use. The data needs to be enhanced with additional context information which is available when preparing the denormalised version of the data for storage into the appropriate datastore.
Storage Tier
The storage tier handles saving the data to various data stores. Data is stored in big data databases, denormalised data lakes, time series databases etc. The denormalised data stores are primarily meant for offline analysis of the data for data science purposes. The time series database (Akumuli) is used to create more interesting near real-time dashboards (via Grafana) that zoom in on groups of devices filtered by geographic location, are of similar type/class etc.
Acknowledgements
Most of the work for the system was done by the huge open source community. The entire work was done by just one person (me) working on my free time. Working on and testing (load/soak/stability/scalability) such a system was a very rewarding experience by itself. Still, there is not that much code that I had to write, since most of it was written by other people. In particular, I would like to thank the following communities:
- ISO C++ committee. They really have made C++ development so easy and quick. And the features just keep coming, at a rate that is much faster than compiler vendors and developers can match.
- Intel for PMDK. Really hit the sweet spot for speed and fault-tolerance.
- ZeroMQ. Newer alternatives such as nanomsg and nng do not seem to be as stable or production ready. Other than these, no other current technology (kafka, nats, redis streams, nsq, …) can match the performance and simplicity.
- Boost. Lot of people do not like it for its sheer size. We use only the header only parts of boost, and have always managed to keep our docker images to under 20Mb.
- Akumuli. Needs a lot more work especially on the documentation side, and the ability to store data in anachronistic order. Still, gives excellent performance and is easy to use.
